

MAPS AND GRAPHICS FOR ENVIRONMENTAL REVIEW
CEQR MAPS
By our count, there are no less than 40 different maps and graphics that routinely appear in EAS's and EIS's—and we prepare every one of them. They concern all types of subject matter, from the location of parks and open spaces, to the size and shape of shadows to be cast from proposed and projected developments. They vary in complexity, from basic land use maps, to the three-dimensional models of so-called “Urban Design Diagrams.”
The graphics used in environmental review application are so numerous, in fact, that we can't show you all of them. What appears in the following pages is just a sample. The point is, we prepare them all.
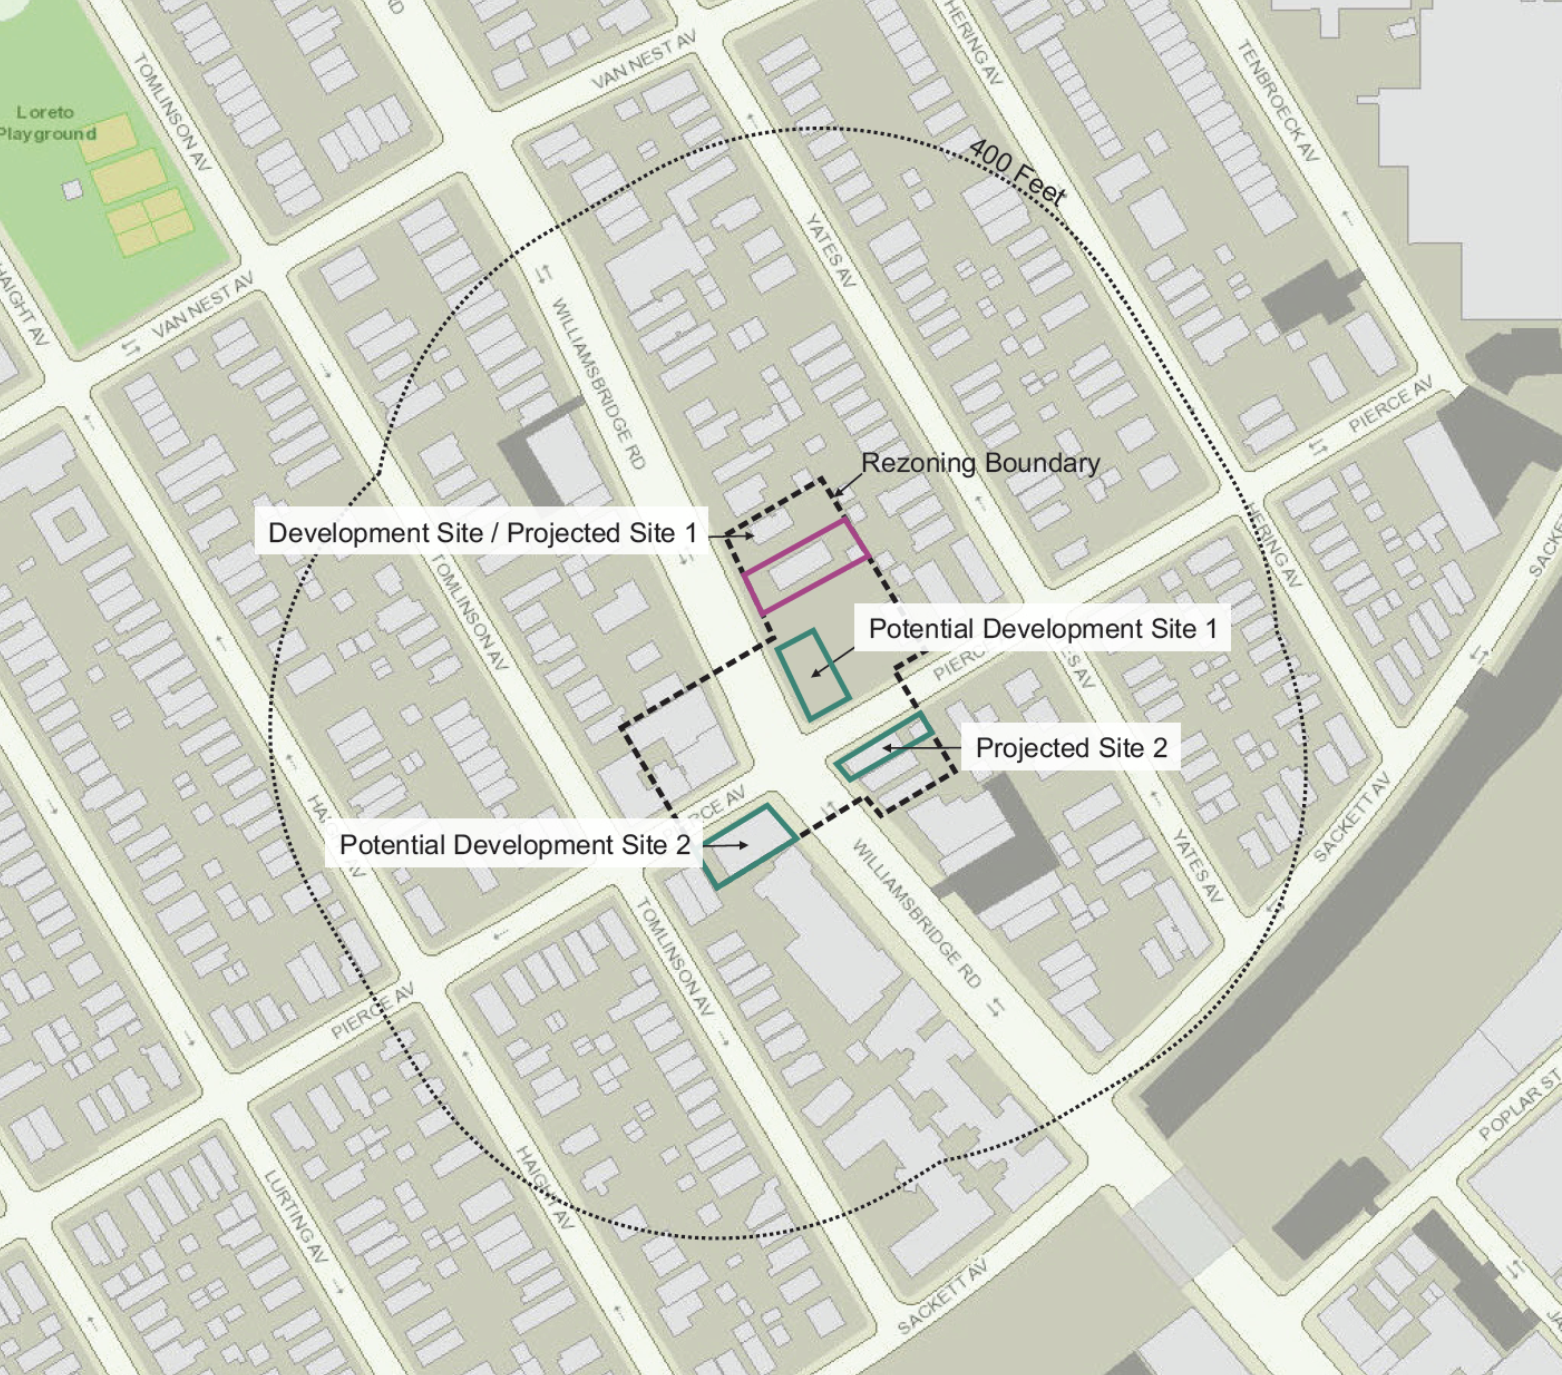
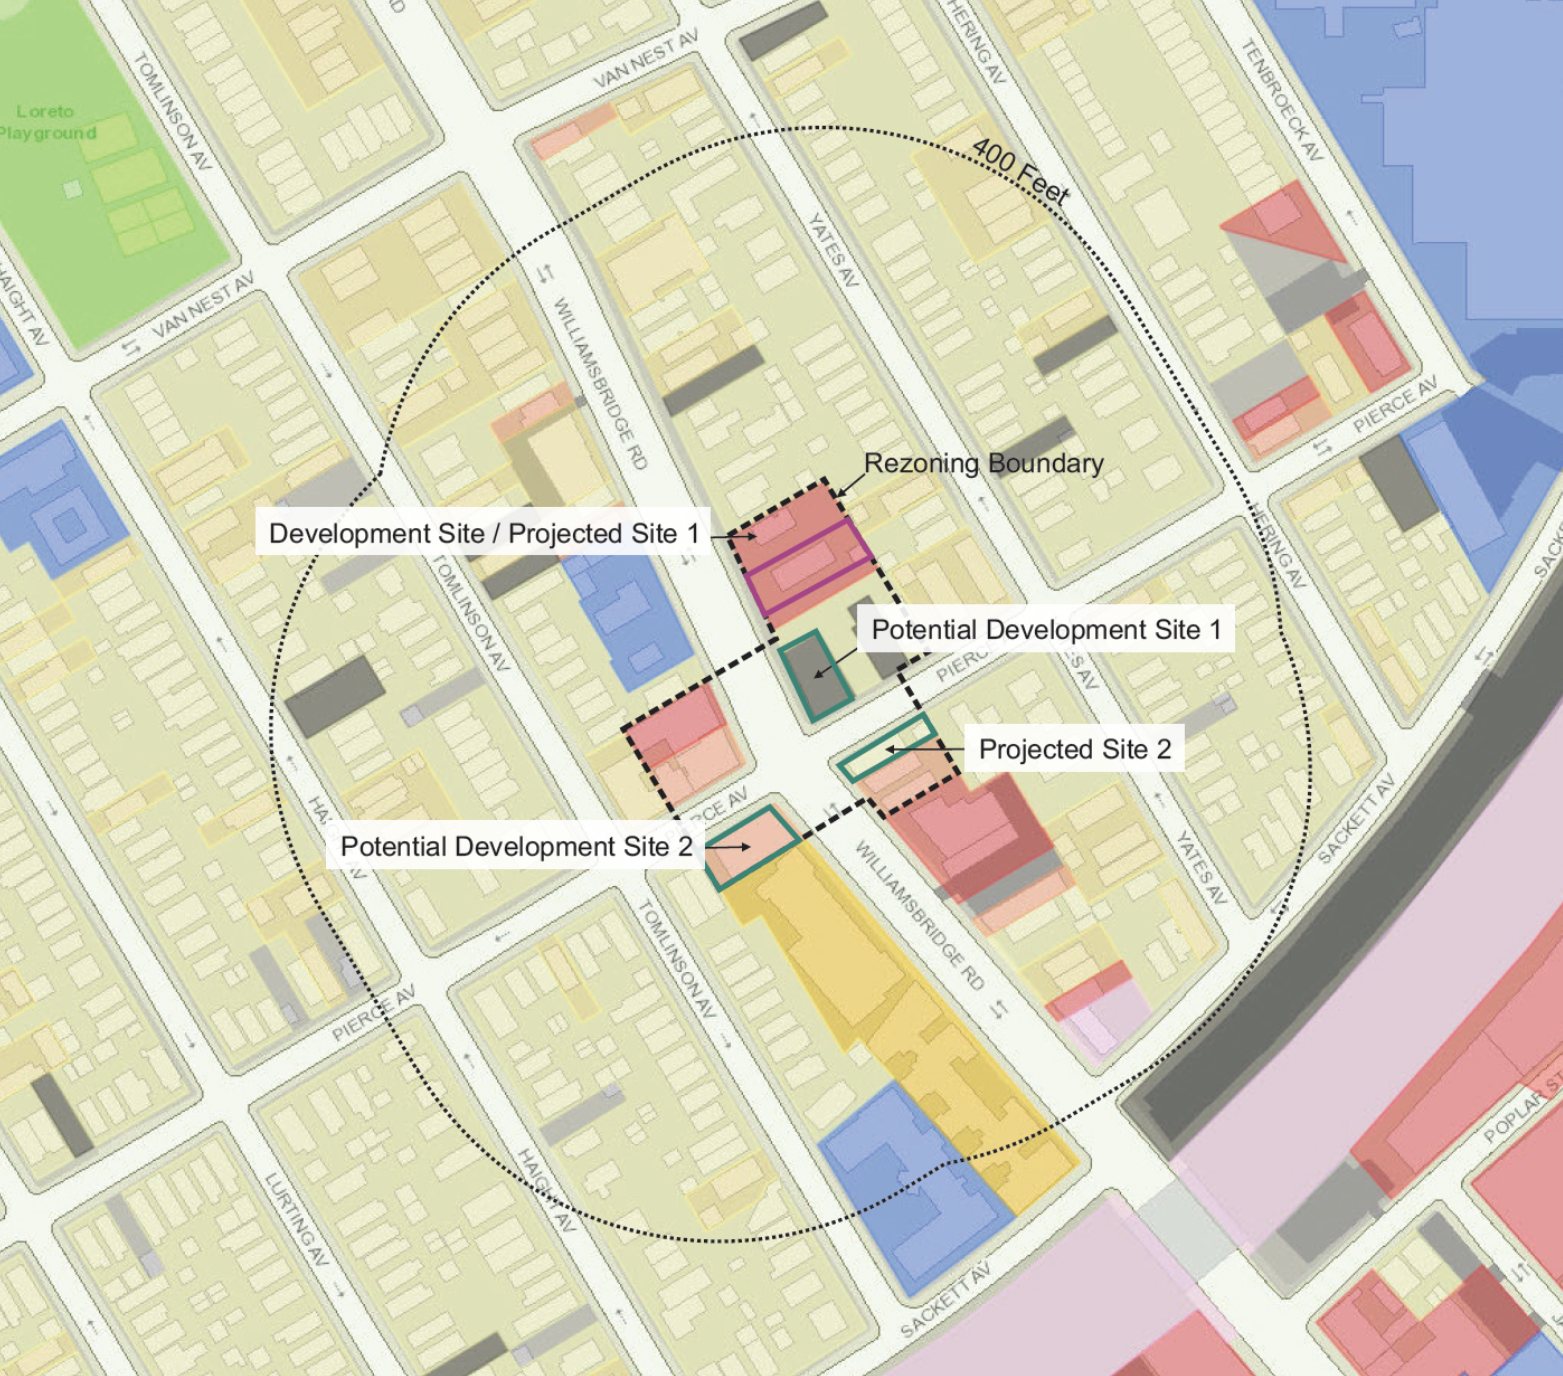
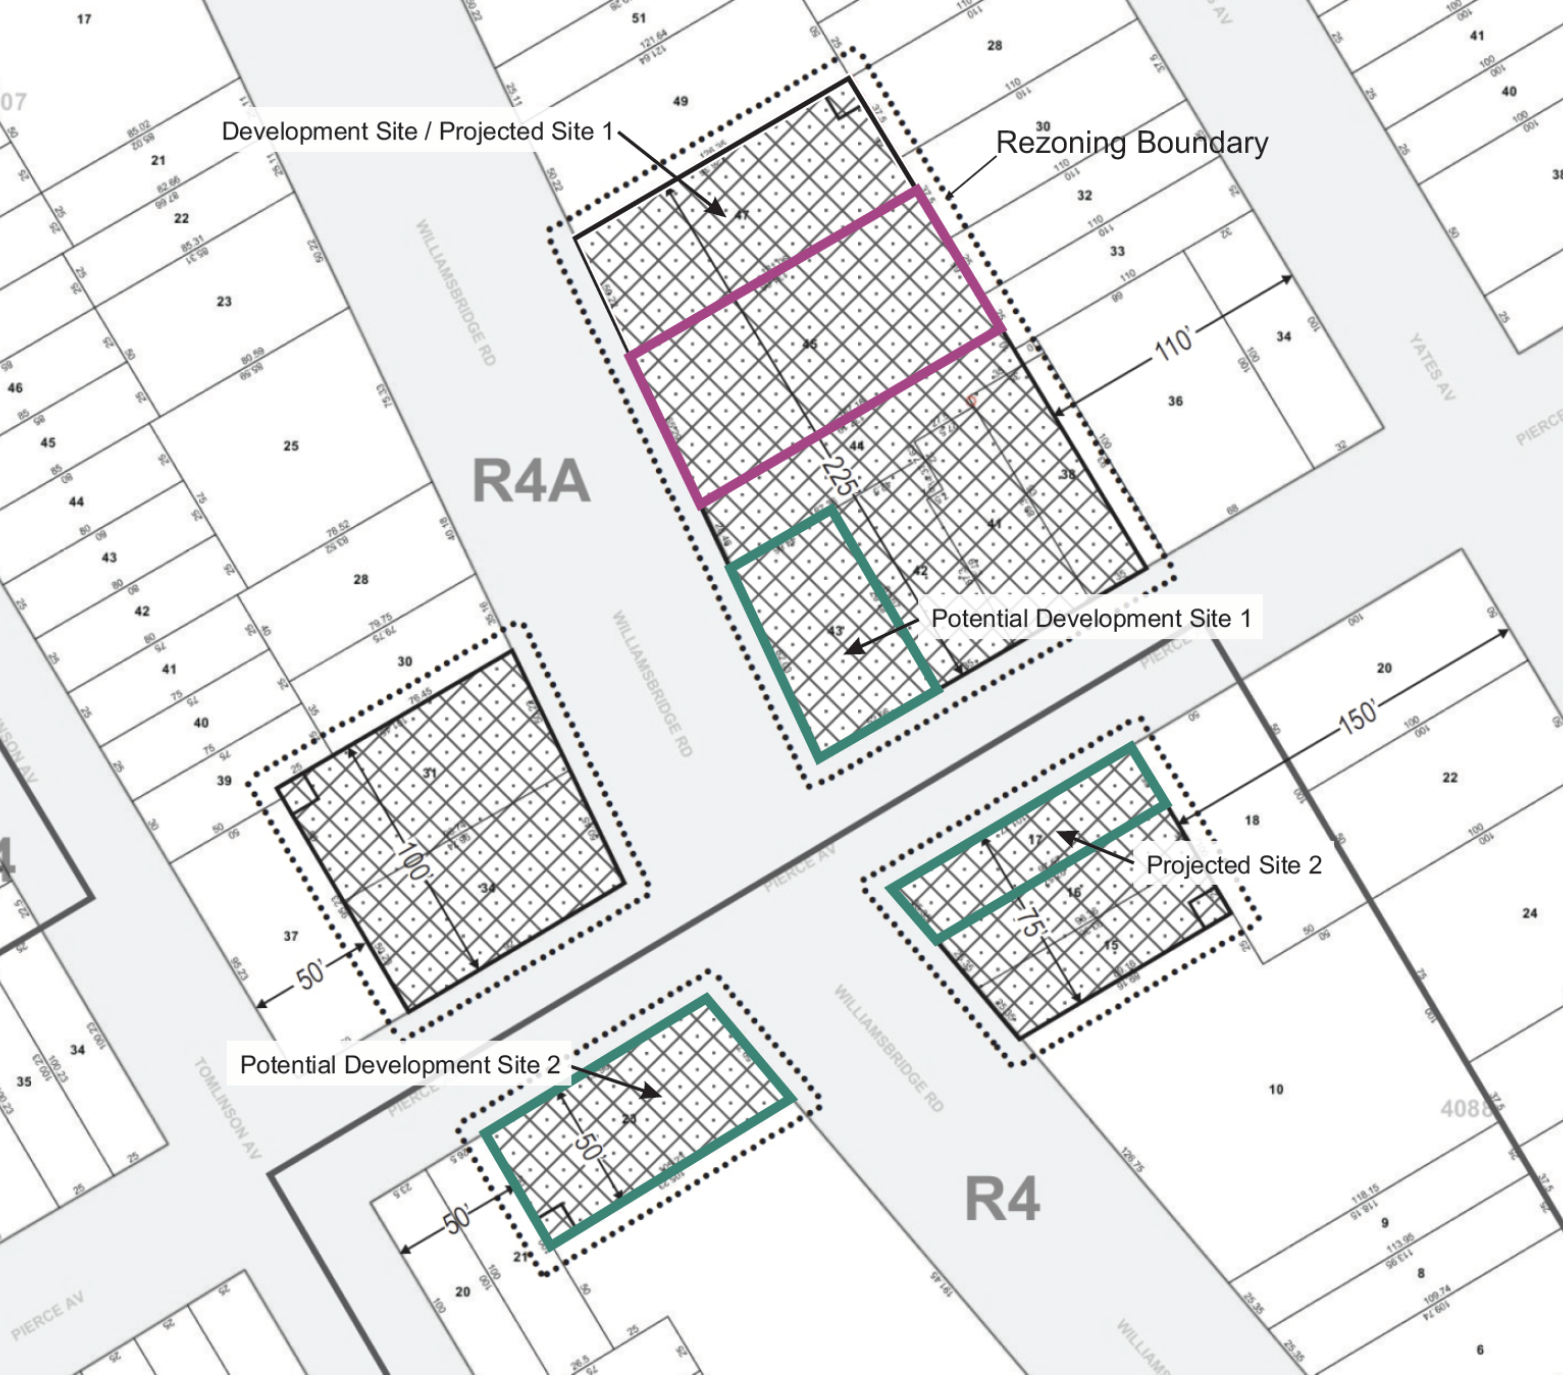
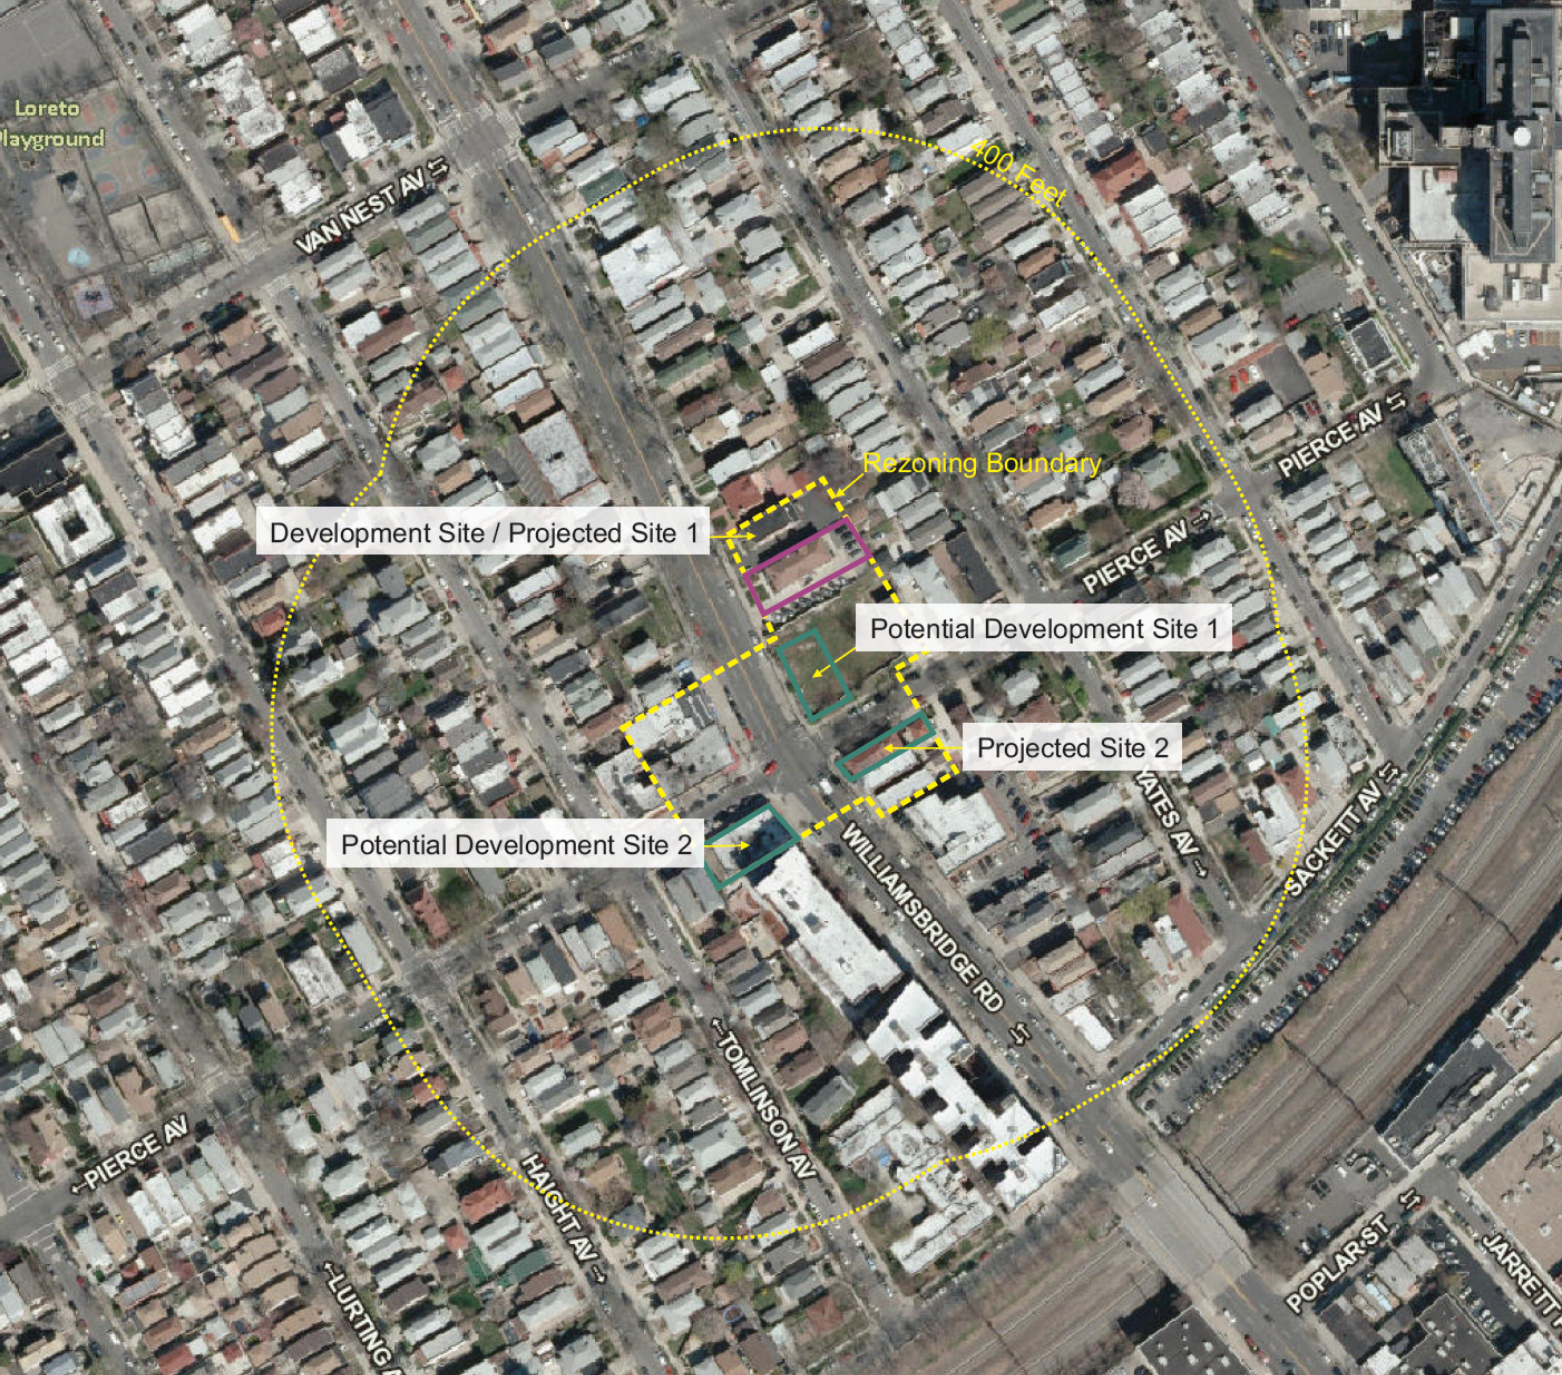
The examples above are the most basic of the lot, and are needed as early as the submission of a Reasonable Worst Case Development Scenario memo. They are, in clockwise order from top left: Site Location Map, Land Use Map, Aerial Map, and Tax Map.

Flood Maps

Historic District Maps

Open Space Maps

Community Facility Maps

CEQR SHADOW ANALYSES
Urban Cartographics offers shadow analyses prepared in a variety of styles: from adhering to specific agency standards, to custom presentations that speak to a specific finding. Most of our shadow analyses are one of two types: those prepared according to the CEQR Technical Manual, and more advanced studies that are prepared for a custom purpose (see following section).
Pursuant to the City's CEQR Technical Manual, a Shadow Analysis must follow a specific process for identifying, or ruling out, the possibility of shadow impacts on "sunlight-sensitive resources" (i.e. parks, open spaces, certain landmarks). In short, the analysis progresses through a series of "tiers;" if an impact cannot be ruled out in one tier, we proceed to the next. For projects that will result in shadow impacts that means, at a minimum, Tiers 1–3, and a set of Tier 3 Incremental Impact drawings; and may require additional three-dimensional diagrams to further illustrate the exact nature of the impact.

ADVANCED SHADOW ANALYSES
Among the myriad products Urban Cartographics prepares, advanced shadow analyses is among the most complex. They are custom products in that they are prepared to address a particular question; or a particular shadow impact, as opposed to running through CEQR's series of tiers.

URBAN DESIGN DIAGRAMS
The Urban Design Diagram is an illustration intended to capture the visual and spatial impact of new development on the streetscape. To that end, it typically features a series of three-dimensional building models, showing both proposed and projected developments, set in the context of a streetview-style photograph. Typically, both "with-action" and "no-action" development scenarios are drawn, dimensioned, and added into the streetview photograph. In addition to modeling the proposed development, Urban Design Diagrams must also include the likely form of "projected" development sites.

DETAILED LAND USE SURVEYS
We're very lucky to have the City's PLUTO land use data available to us with just a few clicks. But what to do when you know the data is wrong, or simply not detailed enough? For example, identifying every building in the area that has ground floor retail frontage. Or, confirming whether the properties shown in purple on a land use map are actually active manufacturing facilities. The answer is to have us perform a detailed land use survey. It's exactly what it sounds like. We go out to the field, and we record both the type of use (i.e. store, restaurant, medical office) and the particular tenant (i.e. Duane Reade, Starbucks) in your project area. The results can be provided in a table, or plotted onto a map. They can also be cross-checked against certificates of occupancy, classified by Use Group, and identified by the closest corollary in the Zoning Resolution's "Index of Uses."

DEP AIR QUALITY PERMIT RESEARCH
A variant of the Detailed Land Use Survey (above) is the Air Quality Permit Search. Here, a survey of the 400-foot radius around a project site is undertaken to confirm the location and activity of manufacturing and industrial properties, and to identify certain noxious commercial and automotive uses (such as dry cleaners, or auto body shops). Once a list of all properties that may have a DEP Air Quality Permit on file is created, a formal request to review such files is made to DEP. Thereafter, once permits associated with the several properties have been identified and pulled from archives, we venture out to the DEP offices in Elmhurst and scan all of the relevant permits to pdf and return them to you.